Abuse of cartographic terminology in our industry is rife. "spheroid" and "datum" are used interchangeably and so is "CRS" and "projection". This is because introductory geodesy and cartography are curiously absent from many university courses, even if those courses have a GIS module. This resuts in a lot of confusion, further compounded by the fact that a lot of the GIS software handles the transformations in the background, without the user having to think about it too much. This is innocent enough - until you plant an expensive oil well 150m off target because your seismic was loaded with respect to the wrong datum.
Through this website I hope to:
Demystify the language and provide some background (THEORY SECTION)
Provide the skills to QC the data that an interpreter is likely to use (TECHNIQUES SECTION)
Discuss methods and tools to manipulate spatial data (TECHNIQUES AND TOOLS SECTIONS)
A better understanding of basic concepts can avoid costly errors in well placement. It will also reduce erroneous interpretations derived from wrongly loaded data. We will start by looking at the definition of a Cordinate Reference System (CRS), sometimes seen as SRS (Spatial Reference System).
Defining the Coordinate Reference System (CRS)
Requirements for the definition of a CRS
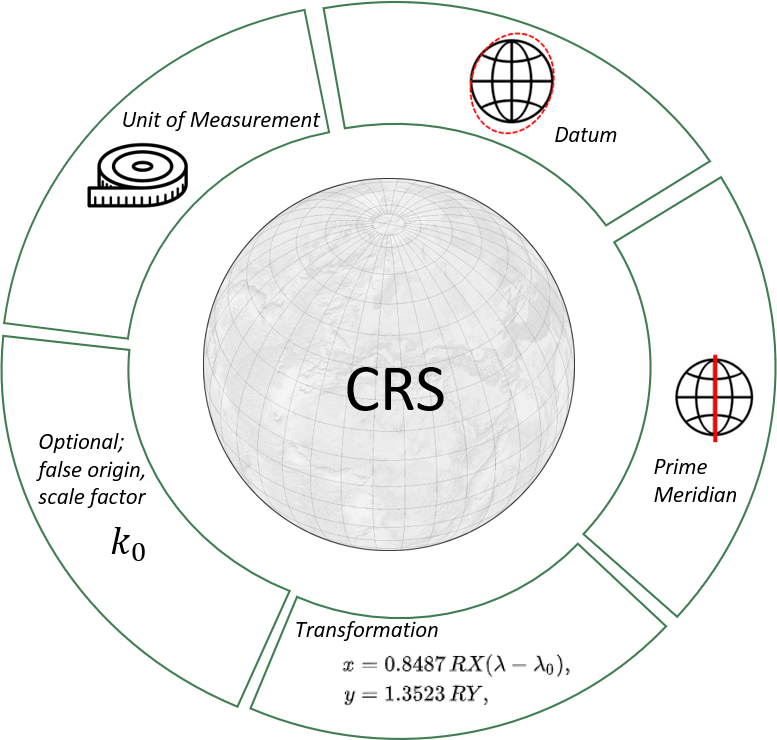
The textbook definition of a CRS calls for 4 prerequisites:
A datum
A unit of measurement
A mathematical transformation
A prime meridian
This is all great in theory and we will look into each element individually, but in the real world not all CRSs have those things defined, while others have all of those defined plus more parameters (such as false origin, scale factors etc). More on that in a minute. First let's take a look at the prerequisites
Datum
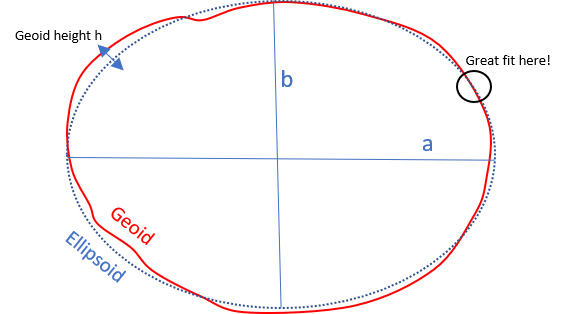
True topography is too detailed to describe mathematically. A harmonic expansion that describes elevation with millimetric accuracy would have zillions of coefficients. It would have to account for each pothole and molehill. A "smoothing" solution (the geoid) is constructed from gravity data to approximate the earth. This is a computationally intensive process and the resulting geoid can be very high-res. Some models have orders of harmonic coefficients in the hundreds or even thousands.
In all likelihood you will never have to look at a Geoid solution unless you work in a very specialised field.
From this Geoid solution (undulating surface) a spheroidal approximation is then derived. This is a spheroidal shape that best fits the geoid. I suppose this makes the spheroid a "model of a model". Among GIS users nearly everyone refers to spheroids as "ellipsoids". I suspect this is because the axes are unequal. There is a semi-major axis a, and a semi-minor axis b. If a=b they would have called it a spheroid.
So we went from TRUE TOPOGRAPHY -> GEOID -> ELLIPSOID
Each ellipsoid has its own degree of flattening and works better in some region than other.
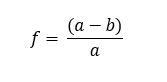
Flattening is simply:
Where f is the degree of flattening, a is the semi-major axis and b the semi-minor axis. In the WGS84 reference ellipsoid the semi major axis is 6378137.0 m and the semi minor axis is 6356752.314245 m
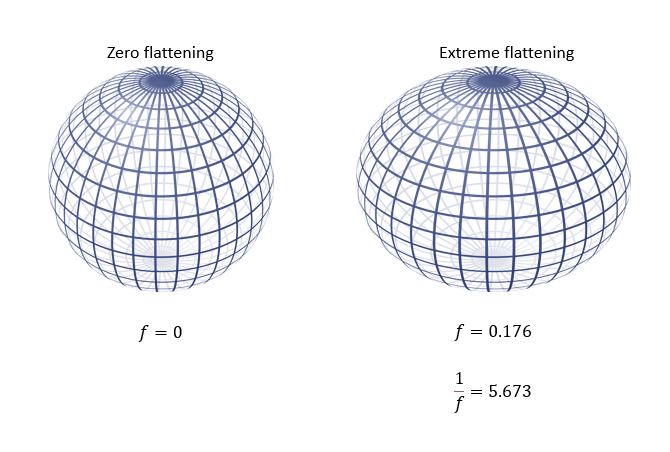
If you note how close the values are you'll realise this fraction will end up being very small. Indeed if you plug in the values you'll get 0.003353 which is why inverse flattening (1/f) is often reported which produces more intuitive values. In this case inverse flattening is around 300 which is easier to recall.
The higher 1/f gets, the more you approach a perfect sphere. For WGS84, 1/f being 300, if the earth was a billiard ball, you could achieve the same degree of flattening by shaving a fifth of a millimetre off the top with sandpaper. On a planetary scale though, the difference is important.
Some datums are Earth-Centered (EC), some spheroids are Earth-Fixed (EF), some are both (ECEF). Using the EPSG website, the proj4 user guide and Stephen Dutch's spreadsheet I have compiled a table of commonly used spheroids and their properties. This can be found here. You can shift from one spheroid to another using what is called a Helmert transformation. For this you need 7 parameters, the wikipedia page is very helpful.
In wikipedia's table the first term in transforming WGS84 to OSGB36 is Cx = -446.448. OSGB36 uses the Airy 1830 ellipsoid so if you check the proj4 entry for Airy you will see "+proj=longlat +ellps=airy +towgs84=446.448,-125.157,542.06,0.15,0.247,0.842,-20.489 +no_defs" . The first term after "+towgs84" is 446.448. As you've probably worked out now, the 7 terms after "+towgs84" are the Helmert coefficients. If you have planned a well in your seismic suite and you are trying to see where it plots in GIS using WGS84 satellite imagery you might have to CHECK the coefficients, especially if you're using a lesser-known CRS. Check out a worked example under the TECHNIQUES section
Units of measurement
For geographic systems: units of angle. Most often it's the degree, but sometimes grads are used.
For projected systems: units of length. Most often it's the meter.
This is a line (Great circle) that defines zero longitude. Unlike the equator, the choice of a prime meridian is completely arbitrary. It may therefore surprise some interpreters when they look at old well reports from Italy that degrees of longitude are in the single-digits or even westerly. This is because they may have been referenced to the Monte Mario prime meridian. Historically Bern, Washington, Madrid and Lisbon and other cities have been used as Prime Meridians. Some systems, such as the UTM global system uses a prime meridian every 6 degrees. In the last 20 years most systems reference the IERS meridian (IRM) which passes about 100 m East of the Royal Observatory in Greenwich. The shift was to ensure that the IRM is a geodetic longitude, that is, its plane must pass through the centre of the earth.
The IRM is not fixed to the UK or any point on the surface. In fact, as the Eurasian plate moves east the Royal Observatory moves relative to the IRM by 2.5 cm per year.
A table of prime meridians can be found here. Where proj4 defined a value it was taken from there.
Transformation
This is a set of equations that map the coordinates to a flat plane so it can be viewed on screen or paper. Map projections have troubled cartographers well before the discipline even had a name. Depending on intended use maps can be conformal, area-preserving or compromise.
Conformality: Conformality means that angles and orientation is preserved. This makes the map useful for navigation (rhumb lines are straight on the map) or if you're viewing a street map on your phone, the angle between street A and street B is the same on the map as is in reality. Perhaps the most famous of map projections, the Mercator, is a conformal map. It preserves these useful properties at the expense of area.
Equal area: Equal-area maps preserve areas. For most conical equal area maps this means picking standard parallels (for example 30 degrees north and south). You compensate by stretching E-W in high latitudes and stratching N-S in low latitudes. In Behrmann the choice is 30 degrees, In Hobo Dyers it's 37.5 and in Gall-Peters it's 45
Compromise: These maps are niether conformal nor equal-area but try to find a balance between the two. They can be very aesthetically pleasing and are commonly used for thematic mapping, especially when they are pseudocylindrical (curved meridians)
It seemed that whenever an attempt was made to preserve shape and angles the areas would be distorted. The opposite was also true: any attempt to preserve area meant that shapes would be wrong.
The polymath Heinrich Lambert was the first to discuss these properties in a formal mathematical framework and he proved that they are mutually exclusive. In addition to his important contributions to physics, astronomy, the introduction of hyperbolic functions and philosophy (a frequent correspondent with Immanuel Kant), Lambert produced some very elegant map projections, some of them conformal and some area-preserving (like the insert below). His equal-area projections predate Gall's by a hundred years, and Gall's projection is of course the basis for Peter Arno's politicised map. Lambert also invented the Transverse Mercator, which, after some adaptations, became the basis for the Universal Transverse Mercator system designed by the US Army and adopted by NATO in the mid 20th century. Seismic interpreters will of course know that UTM is also now the oil industry standard in most of the world.
Lambert Conical Equal Area
Now that we know how coordinate systems are defined, let's look at how Geographic coordinate systems are different to Projected coordinate systems.
Geographic Coordinate Systems
Most coordinate systems with global coverage are geographic. In a geographic CRS, coordinates are given as Latitude and Longitude. For example Bern is approximately 47 degrees North and 7 degrees East. This is nothing but angles from a fixed point, usually the centre of the spheroid.
The equator defines a line of 0 latitude and the prime meridian (usually Greenwich) defines a line of zero longitude. The two lines meet at 0,0 and define the origin of the system. They also meet at 180,0 but no one cares.
Latitude and Longitude
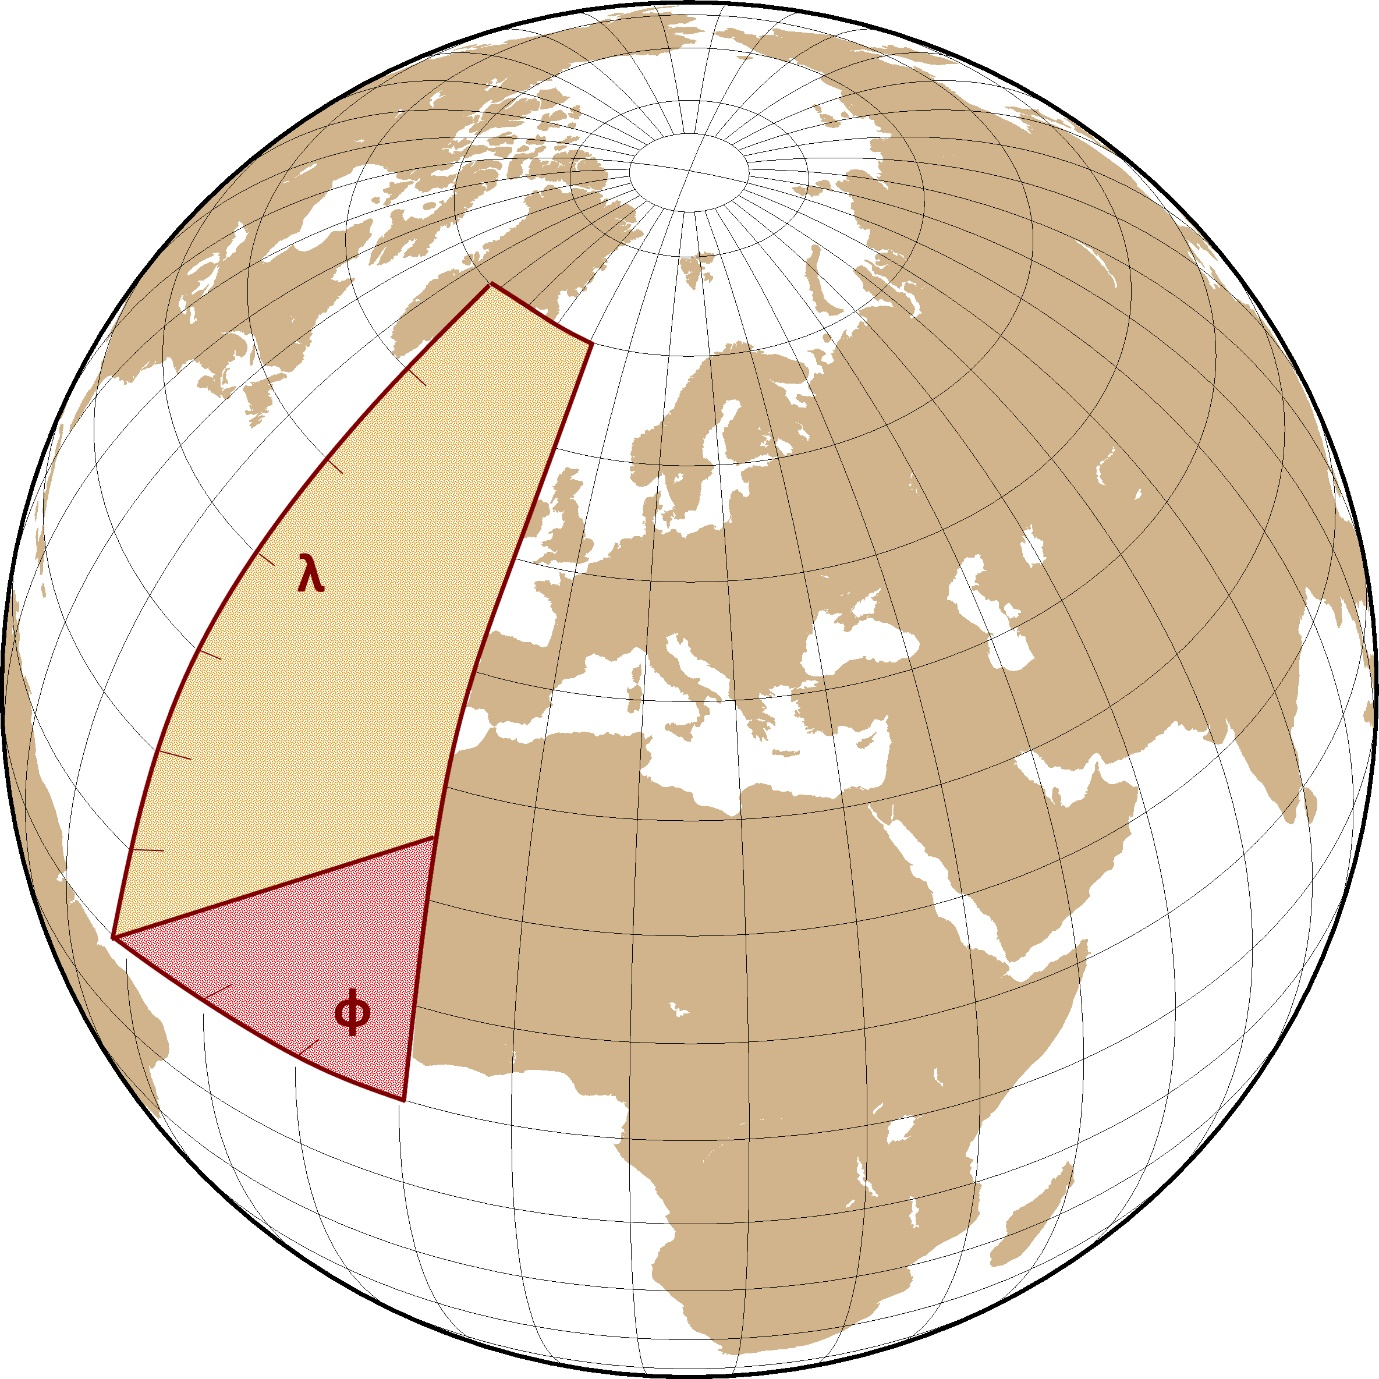
It is helpful to think of yourself as sitting inside the sphere. If you are sitting at the centre of the sphere and you want to look at Greenland, you would have to tilt your head 70 degrees up from the plane of the equator (latitude) and 20 degrees to the west of Greenwich (longitude). Latitude is often denoted by the Greek letter phi and longitude by the Greek letter lambda (see picture above).
This isn't the whole story unfortunately. Recall from the "Datums" section that the earth isn't a perfect sphere and many approximations exist. The have various degrees of flattening; that is they deviate from a perfect sphere by minute, miniscule percentages that will however manifest as meaningful differences at the surface, perhaps by hundreds of meters.
Nowadays WGS84 (using the GR80 ellipsoid) is so prevalent that a pair of Lat-Lon coordinates is assumed to be enough to precisely identify a point on the earth. In reality however, 30N 40E is not the same point if you use different datums. Latitude and longitude are not adequate to accurately map a point on the earth. The same latitude and longitude will plot differently if the spheroid used is "fatter" or "slimmer".
The amount of industry professionals that are unaware of this fact is simply staggering. Company press releases, presentations and government bulletins often quote Latitude and Longitude independent of geoid. This is understandable in an age of GPS and satellites, but it is an absolute nightmare when working with legacy data. 1984 was not that long ago, there exist PLENTY of databases that reference older systems. The seismic interpreter needs to be careful with old well reports citing latitude and longitude and must be comfortable with the various formats of Latitude and Longitude.
One major drawback of geographic coordinate systems is that it's very impractical to measure distances between points. If you don't believe me, try to answer this:
How may meters between these two points:
A: 37.75N 51.22W
B: 37.77N 51.23W
Where do you even begin? 1 degree of latitude does not have the same length as 1 degree of longitude, and the difference increases with latitude. E-W stretching is proportional to 1/cos(latitude) which means it tends to infinity at the poles. It's very hard to measure lengths or areas in this way. The actual solution is given by the Haversine Formula but I'm sure by now you're thinking "give me a break".
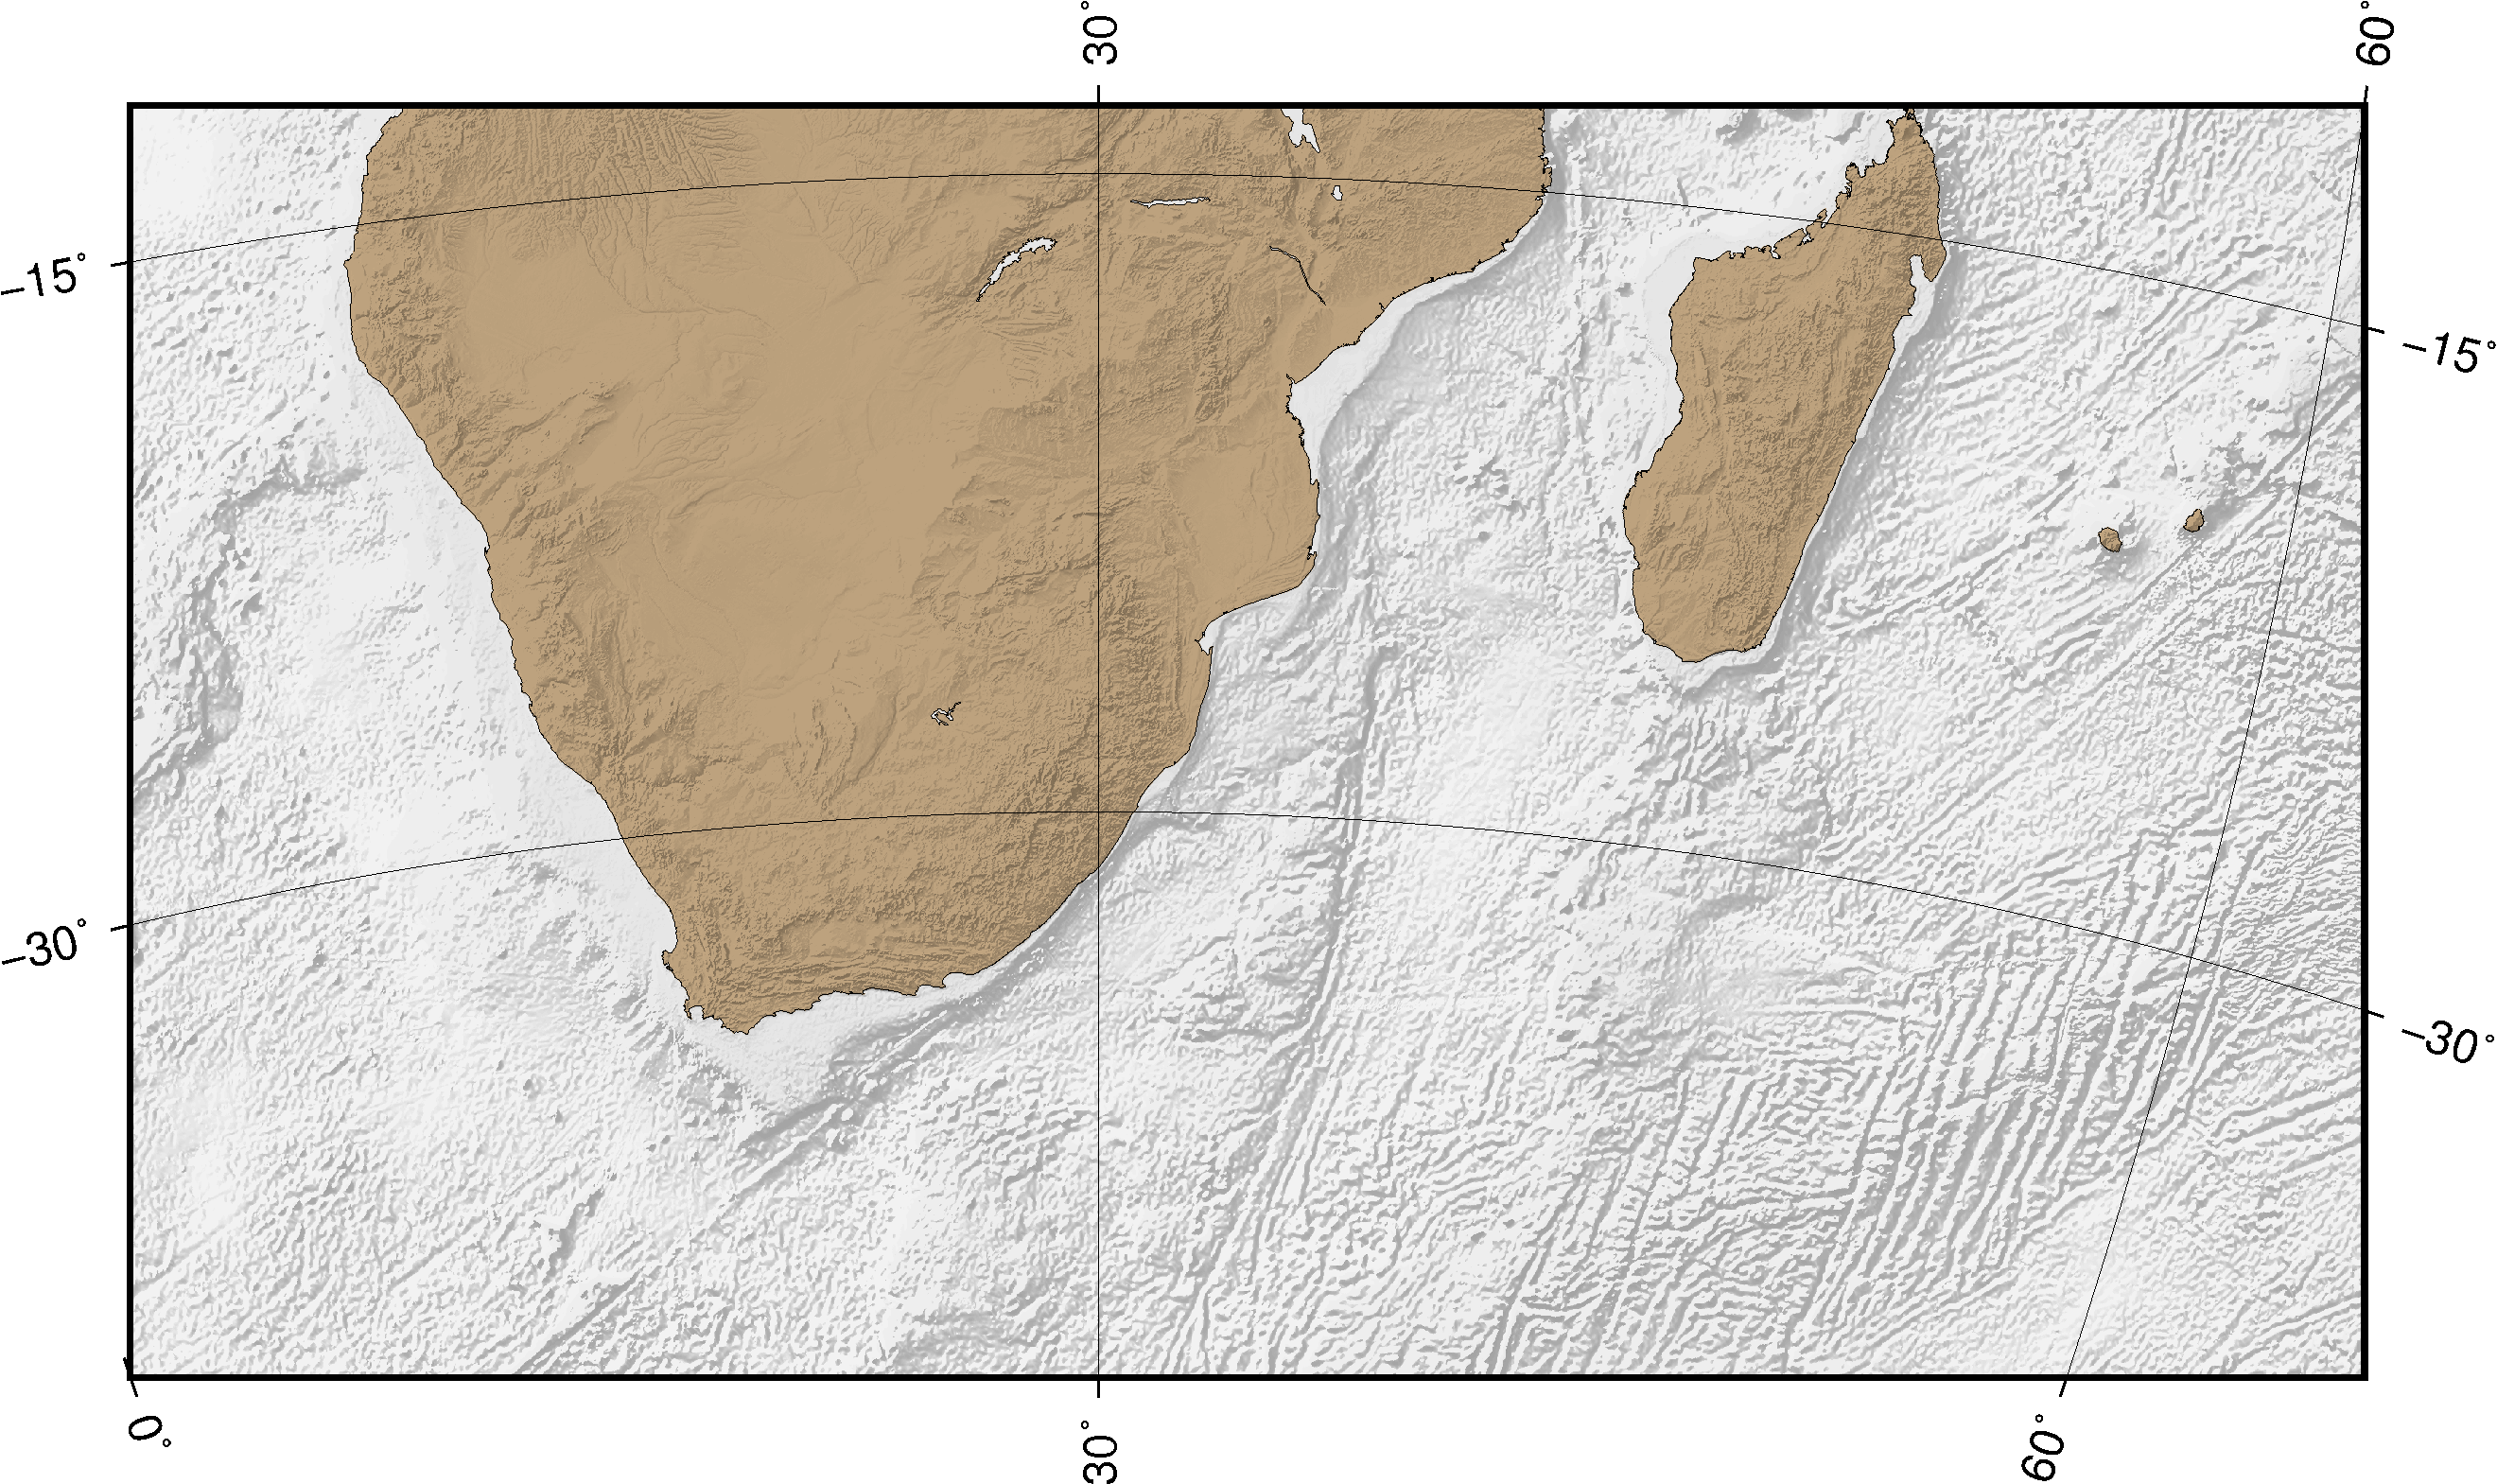
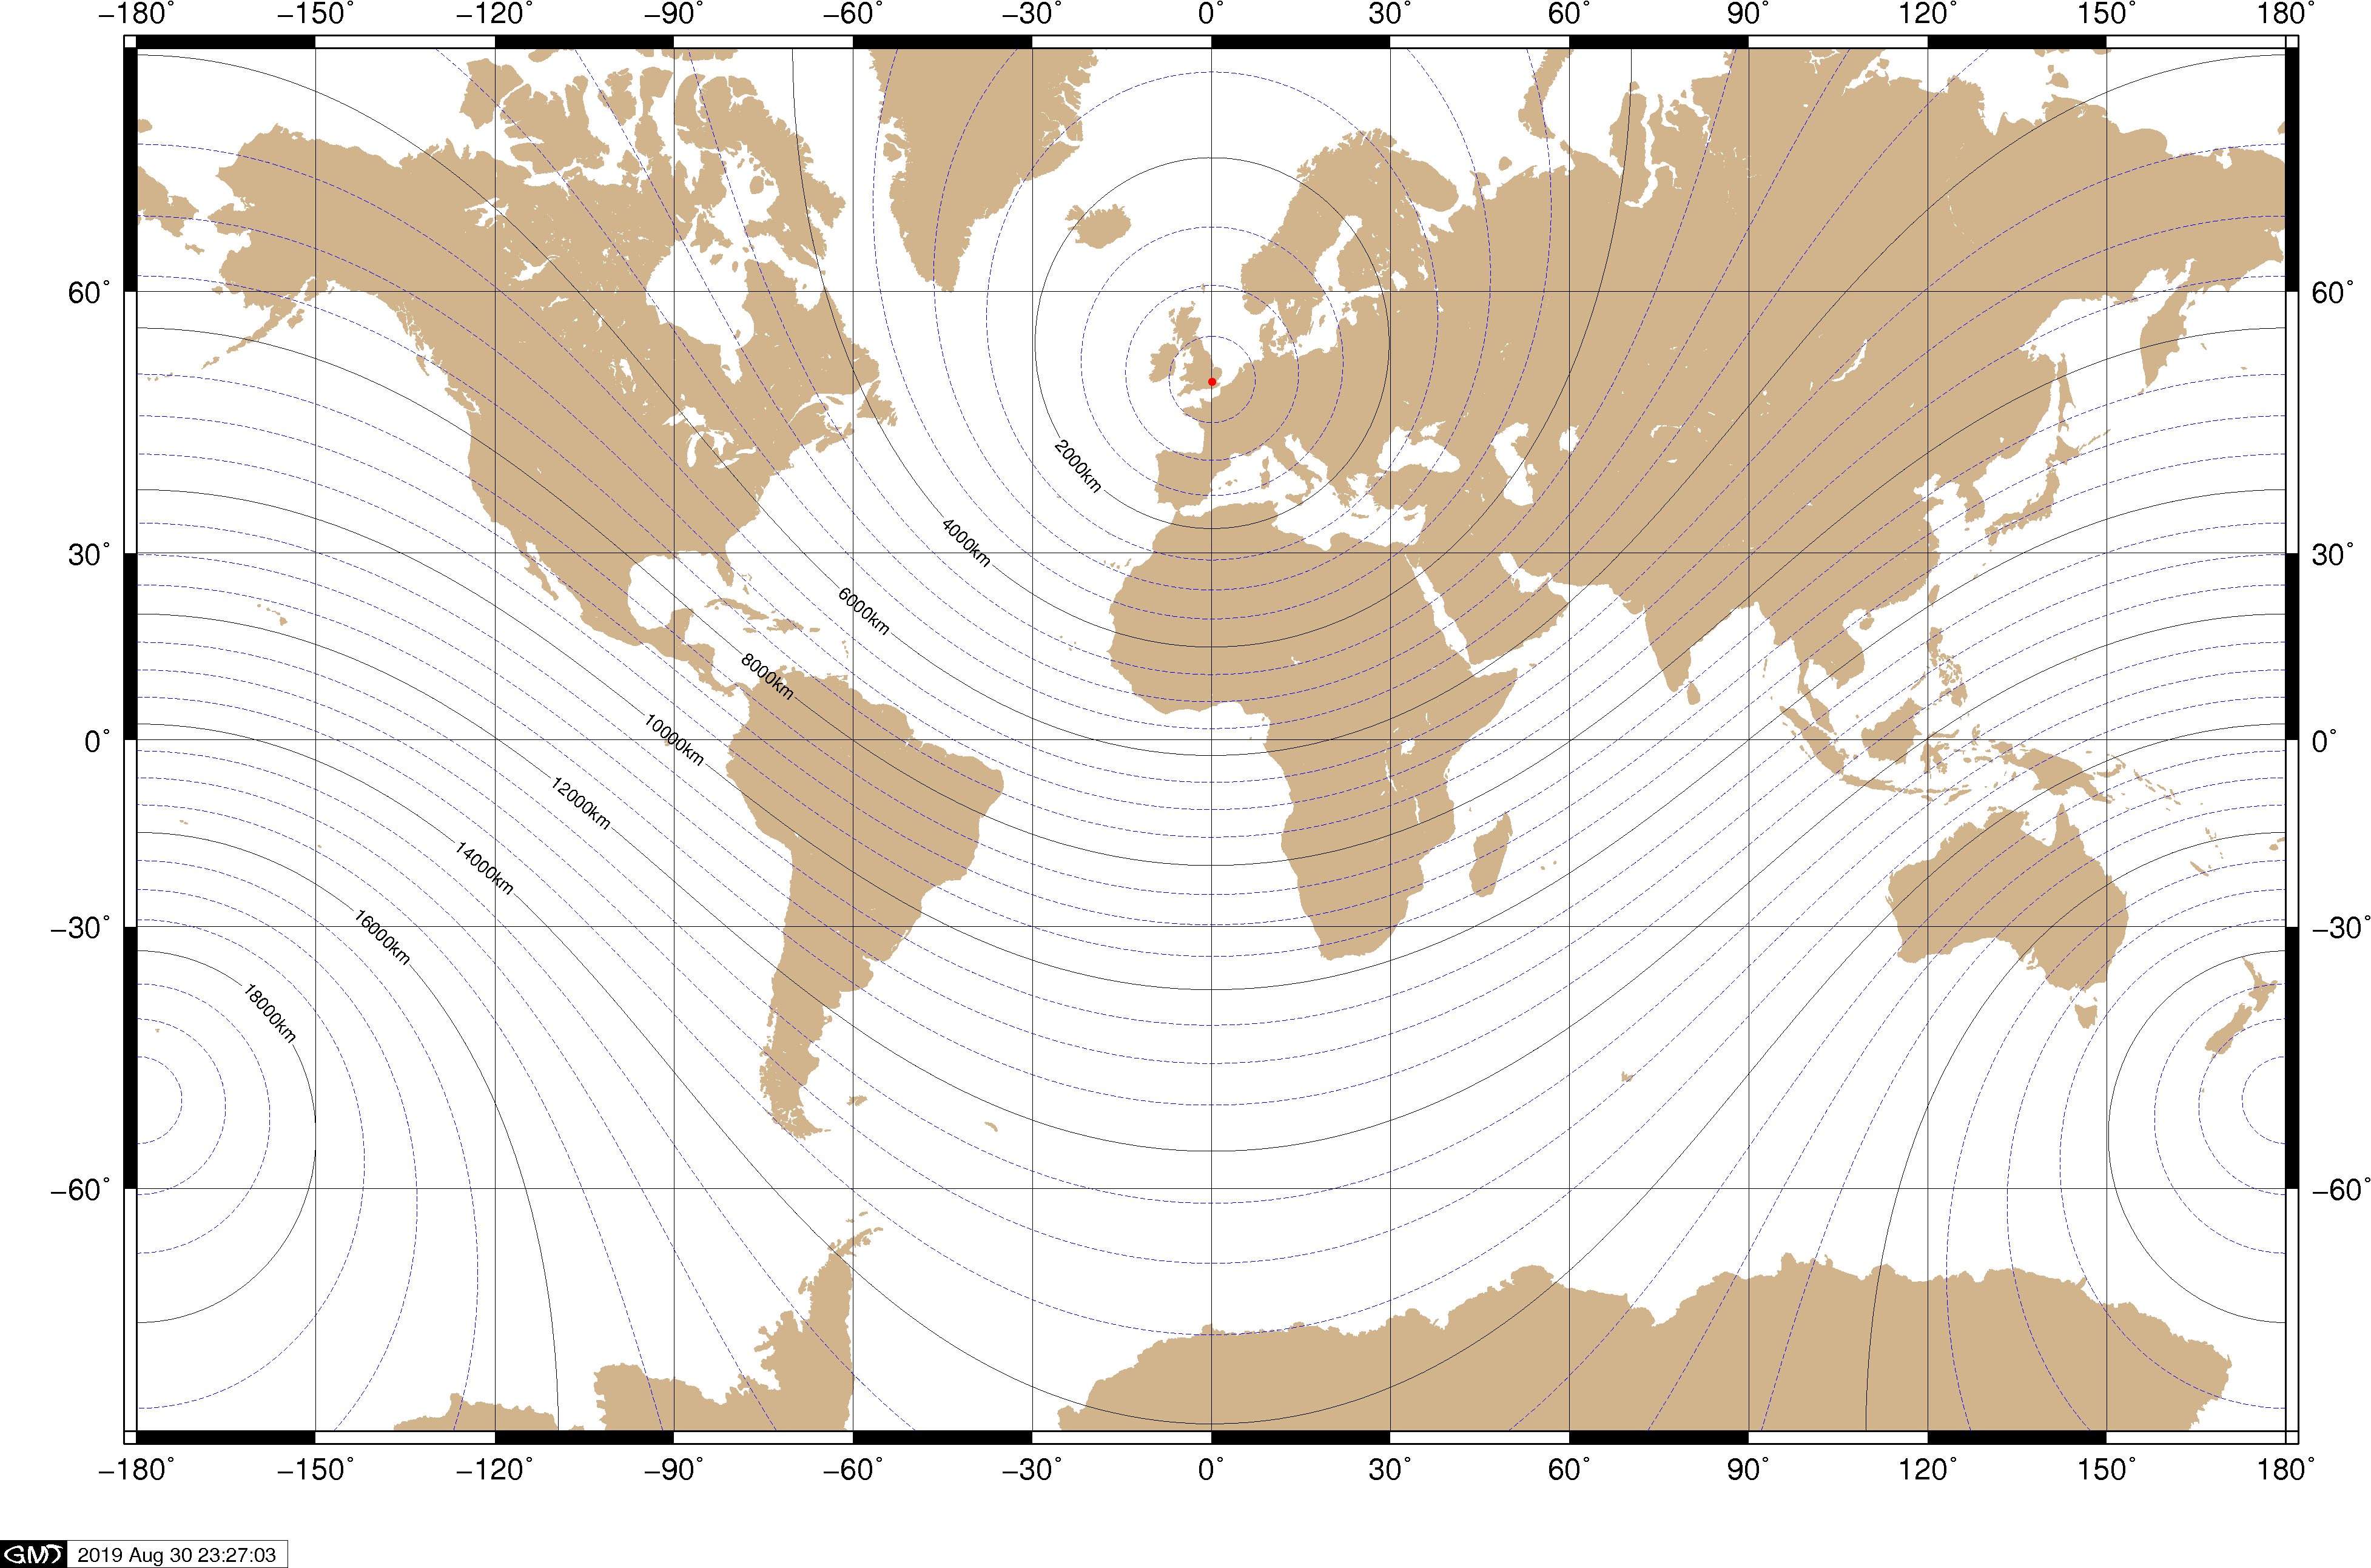
The insert below shows the distortion in a Geographic CRS by contouring distance from London. The contour interval is constant (1000 km) but visually on the Mercator you can see the spacing increases with latitude which is an elegant way to show distortion without having to look at the Tissot indicatrix.
Variation of Distance with Latitude
This unequal scaling of lengths is a big part of why we don't use geographic systems for seismic interpretation. Other reasons are probably the fact that it makes it harder to Quality-control spacing within your project (spacing between shotpoints for example) and the fact that it would be very hard to planimeter mapped features. Much like area surveyors and the military, the oil industry works with Projected Coordinate Systems.
Projected Coordinate Systems
When the area of interest is sufficiently small that the curvature of the earth won’t introduce serious errors when flattening it is possible to use a projected CRS. In these systems, degrees are projected into a cartesian grid where the unit is linear (usually the meter) and is the same in all directions. A location is given by X and Y commonly called the Easting and Northing respectively. Projected coordinates often look like this:
X: 256779
Y:4134555
By far the most prevalent projected coordinate system in the industry (as well as all NATO militaries) is Universal Transverse Mercator, or UTM for short. All seismic interpreters need to be familiar with the basic concepts behind UTM.
The Universal Tansverse Mercator
UTM is family of transformations covering the entire world except for the polar regions. Those are covered by UPS (not the courier company).
UTM divides the world in long vertical strips. This is why UTM coordinates always have 7 digits for Northings and 6 digits for Eastings, they are taller than they are wide. There are 60 zones, each 6 degrees wide. Distortion anywhere within the zone is less than 0.1% of whatever you are measuring and besides, most GPS systems are only accurate to within 5m at best.
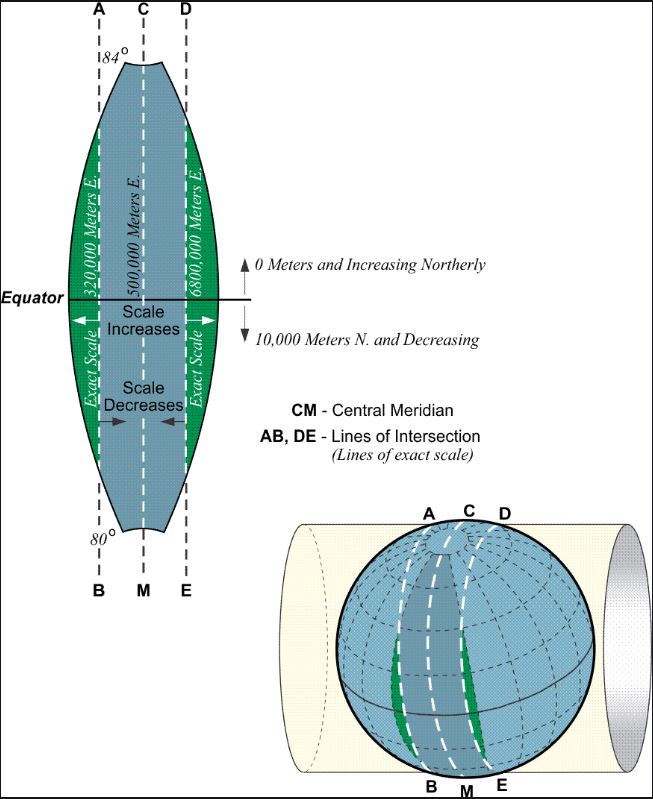
In most projected coordinate systems (for example in UTM) X and Y will never be negative value because a "false origin" is used. This is 50000 meters to the west and 10000000 meters to the south of the true origin in the case of UTM zones.
Image from John A. Dutton Institute, Penn State
UTM is a secant projection and therefore uses 2 standard parallels. Distortion is zero along the standard parallels, and scale actually decreases as you approach the central meridian to a minimum of 0.9996. At this error, a 100m long building would project as 99.96m, the error is virtually imperceptible for all topographic applications. Scale increases beyond the sandard parallels but nowhere within the zone is the error more than 1 part in 1000.
The State Plane System in the USA
Like UTM this is a collection of zones or systems. Unlike UTM, the State Plane System (SPCS) is designed specifically for the USA, and doesn't typically use the meter. The projection used is Lambert Conformal Conic if the state is "fat" in extent, and transverse mercator if it is "taller" in extent.
Each US state will have one or more zones. Take care with units, because in the USA the foot is common, and the US survey foot is quite common too! You might also get two "flavours" of datums NAD83 and the older NAD27. Let's take Colorado as an example:
Datum
Focus Area
Unit
Projection
EPSG Code
Comments
NAD83
Colorado CENTRAL
Foot (international)
Lambert Conformal Conic
6427
-
NAD83
Colorado CENTRAL
USft
Lambert Conformal Conic
6428
-
NAD83
Colorado NORTH
Foot (international)
Lambert Conformal Conic
6429
-
NAD83
Colorado NORTH
USft
Lambert Conformal Conic
6430
-
NAD83
Colorado SOUTH
Foot (international)
Lambert Conformal Conic
6431
-
NAD83
Colorado SOUTH
USft
Lambert Conformal Conic
6432
-
NAD27
COLORADO CENTRAL
Foot (international)
Lambert Conformal Conic
???
Not sure this combination exists
NAD27
COLORADO CENTRAL
USft
Lambert Conformal Conic
26754
-
NAD27
COLORADO NORTH
Foot (international)
Lambert Conformal Conic
???
Not sure this combination exists
NAD27
COLORADO NORTH
USft
Lambert Conformal Conic
26753
-
NAD27
COLORADO SOUTH
Foot (international)
Lambert Conformal Conic
???
Not sure this combination exists
NAD27
COLORADO SOUTH
USft
Lambert Conformal Conic
26755
-
NAD83
COLORADO CENTRAL
metre
Lambert Conformal Conic
3501
Hardly SPCS at this point
NAD83
COLORADO NORTH
metre
Lambert Conformal Conic
3503
Hardly SPCS at this point
NAD83
COLORADO SOUTH
metre
Lambert Conformal Conic
3505
Hardly SPCS at this point
Question1
What's a good answer to the question "what's the CRS for this seismic project?"
The project is in UTM30
The project is in WGS84
The project is in ESPG:32630
The project is in +proj=utm +zone=30 +ellps=WGS84 +datum=WGS84 +units=m +no_defs
The project is in UTM30 on WGS84
Options 3,4 and 5 are correct (and the same thing).
Detailed Answer
Answer 1 mentions transfornation but not datum. In these modern times of GPS it can be assumed that the datum is WGS84. THIS IS A DANGEROUS ASSUMPTION. Even though the assumption would be right most of the time, 1984 wasn't that long ago. There was plenty of seismic shot before 1984, and even until the early 2000s ED50 was a popular datum in Europe. UTM coordinates on ED50 datum are still common. Always report your datum, always check your SEG-Y header. Better yet, check the original navigation reports if you can find them.
Option 2 is completely nonsensical. WGS84 on its own is not a cartesian CRS and I don't see how a seismic project would be set up in a geographic CRS.
Option 3 is a good way to communicate. This is the EPSG code, and the European Petroleum Survey Group will have provided a definition of the CRS if you look it up
Option 4 is the proj4 definition of this particular CRS and if you are the kind of person who would memorise THAT, you probably don't need this website
Option 5 is intuitive, easy to remember and gives others comfort in that you've considered both: the transformation and the datum.